GA4 has become the core tool for understanding what visitors do, improving a website and making decisions on evidence. Unlike Universal Analytics, the version it replaced, GA4 is built on events, so it can measure any interaction that matters, from a scroll to a form submission. Whether you run a company website or ad campaigns, here is how to use it, step by step.
Why GA4 matters today
GA4 focuses on events, engagement and what real people do, so it shows how visitors move through your site, what they do there and which pages need work. It also offers data-driven attribution, which shares the credit for each key event across the touchpoints that led to it. If your site has logins and sends a user ID, GA4 can join one person’s visits from different devices into a single journey.
- Event-based measurement for detailed tracking
- Better attribution and a clearer view of the customer journey
- Direct connections to Google Ads and Data Studio
- Realtime reports that show activity from the last 30 minutes
Set up GA4 correctly
Correct setup is what makes every later report trustworthy. Gaps mean missing events, wrong reports and decisions based on the wrong numbers.
- Create a property and connect your website. In Admin, under Data collection and modification, open Data streams, add a web stream and install the Google tag on every page.
- Turn on enhanced measurement in that web stream’s settings.
- Check your tracking in DebugView, in Admin under Data display. Open your site through Google Tag Assistant first, which turns on debug mode.
- Mark your key events. GA4 calls the actions that matter most key events, not conversions. In Admin, under Data display, open Events and star each one, such as a lead form.
- Link Google Ads in Admin, under Product links, to create Google Ads conversions from your key events.
Understand GA4’s event-based model
Universal Analytics grouped data into sessions made of different hit types. In GA4, every interaction is an event, with parameters for the details, such as the link someone clicked. With enhanced measurement on, GA4 records page views, scrolls, outbound clicks, site searches, file downloads, form interactions and embedded YouTube video plays without extra code. Understanding events lets you measure what matters to your business, not generic numbers.
Common events:
page_view: each time a page loadsscroll: the first time a visitor reaches 90% of a page’s depthclick: a click on a link to another websiteview_item: a product view, a recommended event you send yourselffile_download: a click on a link to a file such as a PDFform_submit: a form submission
Track the metrics that matter
GA4 judges engagement by what visitors do. An engaged session lasts longer than 10 seconds, includes a key event or has at least two page views, and engagement rate is the share of sessions that were engaged. GA4 still reports bounce rate, but only as the opposite: the share of sessions that were not engaged. Together, these show whether people found a page useful, not only whether they arrived.
- Engagement rate
- Engaged sessions
- Average engagement time: how long your site was in focus in the visitor’s browser
- New users and returning users
- Key events
Analyze traffic sources with the acquisition reports
The acquisition reports show which channels bring visitors and what they do once they land. Traffic acquisition, under Reports and then Acquisition, covers new and returning users, while User acquisition shows where new users first came from. Use them to judge each channel by quality, not only size, before you decide where time and budget go: organic search might bring the most visitors while email or paid ads bring more key events.
Questions they answer:
- Which channels bring the most engaged users?
- Which platforms lead to key events?
- Which campaigns are underperforming?
- Which sources deserve more budget?
Update, October 2026: Since May 2026, GA4 puts visits from AI assistants such as ChatGPT, Gemini and Claude in their own AI Assistant channel, so you can compare them with organic search. My checklist for getting cited in AI answers shows how to earn those visits.
Build funnels to see where users drop off
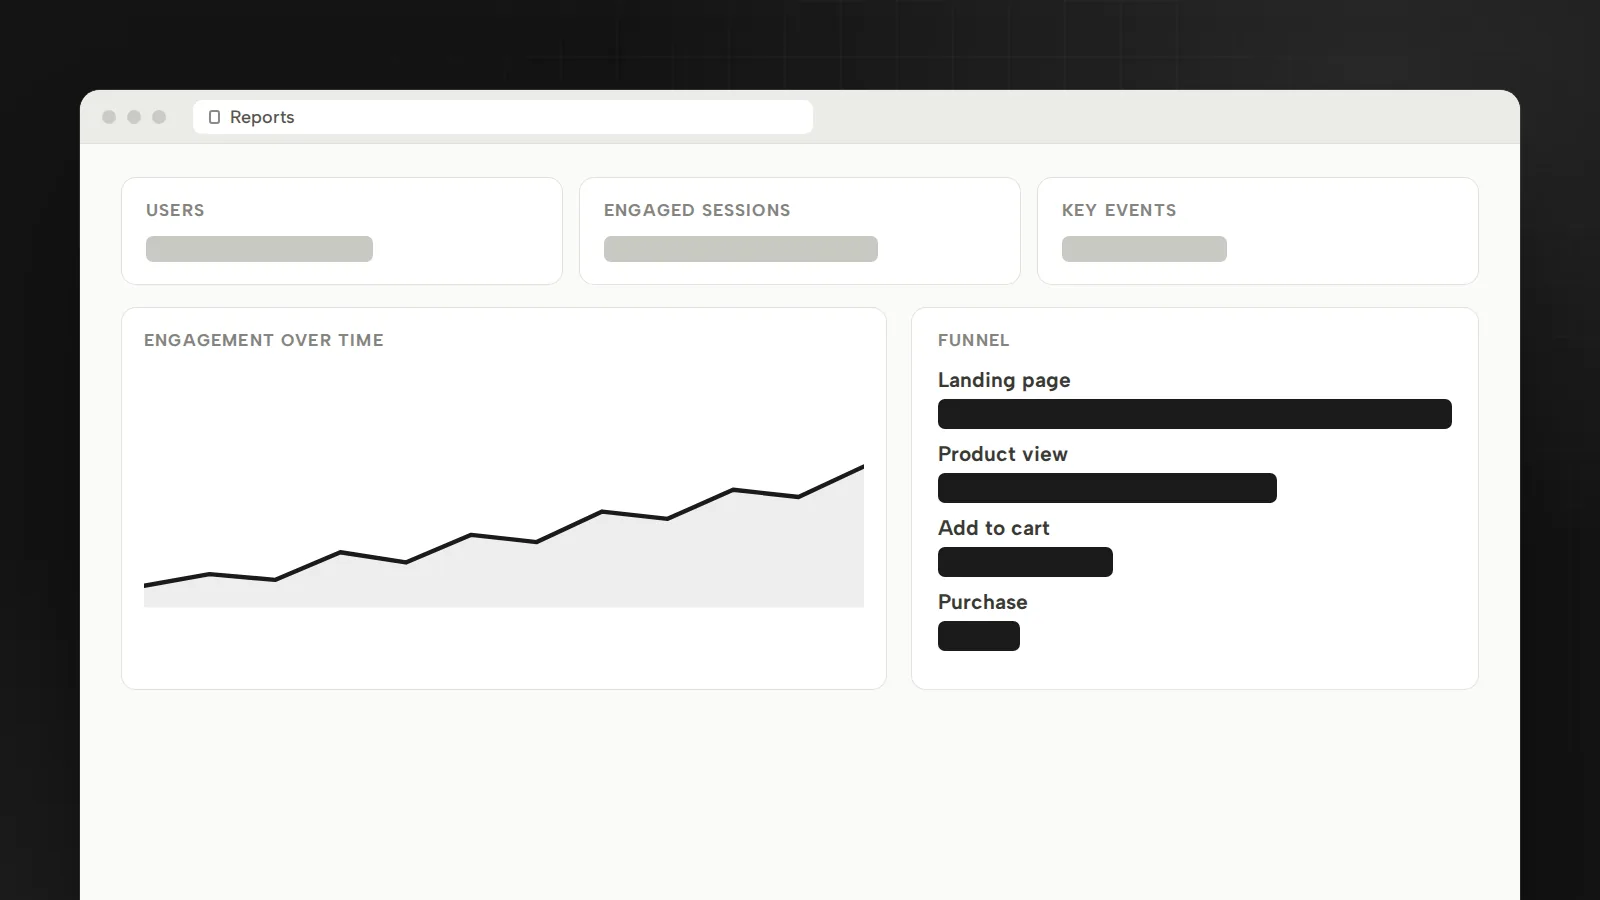
A funnel exploration shows the steps visitors take to complete a task and how many make it through each one. One visitor gives up halfway through the contact form. Another browses products but never adds one to the cart. The funnel shows which step loses people, so you fix that step instead of guessing.
Useful funnels to build:
- Home page → product page → cart → checkout
- Blog post → service page → contact form
- Landing page → call to action → lead form submitted
Use explorations for deeper analysis
Explorations, under Explore in the left menu, follow how behavior unfolds, group users by what they do, show the value customers bring over time and surface patterns the standard reports miss. Decisions then rest on what people did, not on guesses.
- Path exploration: the paths visitors take through your site
- Funnel exploration: the steps to a goal and where people leave
- Segment overlap: how the segments you create, such as mobile visitors and buyers, relate to each other
- Cohort exploration: the behavior of groups of users who share an attribute
- User lifetime: behavior and value over a customer’s lifetime
Track the events that matter to your business
GA4 lets you add your own events for the actions tied to your goals, such as completed forms, video plays, add-to-cart clicks, scroll depth and clicks on your calls to action. They show what visitors really engage with, which improves both the website and the marketing.
I set them up in Google Tag Manager with a Google Analytics: GA4 Event tag and a trigger, and test them in Preview mode before publishing. Use Google’s recommended events and their parameters where they fit, which Google says gives you the most detail in reports.
Events worth tracking:
- Form submissions (
generate_lead) - Add to cart (
add_to_cart) - Clicks on your calls to action
- Product views (
view_item) - Outbound link clicks, which enhanced measurement already records as
click - Newsletter sign-ups
Turn GA4 data into action with Data Studio dashboards
Data Studio, Google’s free reporting tool, turns GA4 data into dashboards anyone can read, so clients and your team see clear charts instead of raw reports. A good dashboard shows your KPIs, traffic sources, top pages, funnel steps and key events, laid out so people can act on them.
- Scheduled delivery: a PDF of the report emailed to your stakeholders on a schedule
- Clear visuals in place of tables of numbers
- Connectors for Google Ads, Search Console and YouTube Analytics
- Easy sharing with your team
- Custom KPIs that match your goals
Update, October 2026: I wrote this guide when the tool was called Looker Studio. Google renamed it back to Data Studio in April 2026, and existing reports carried over. GA4 also added its own Dashboards in September 2026, but Data Studio is still the tool for combining GA4 with other sources.
Use GA4 insights to improve your website
GA4 is more than a measurement tool. Read well, it shows weak pages, obstacles in your funnels and the paths that lead to key events. Start with the Landing page report, under Reports and then Engagement: it lists the first page of each session with its engagement time and key events, so you can see which pages need work and which to test first. For what to change on the page itself, read how to build a high-converting website.
GA4 insights help you improve:
- Landing page performance
- Navigation and user experience
- Internal linking
- Form conversions
- The return on your SEO work
- Funnel completion rates
Common GA4 mistakes beginners make
Beginners often misread GA4 or skip a setup step, and both lead to wrong conclusions. Avoid these five:
- No key events. Without them, GA4 can’t show which channels and pages bring the actions you care about.
- Misreading engagement rate. Bounce rate is its exact opposite, so a rise in one is a fall in the other, not two separate results.
- Skipping DebugView. Test every new event before you trust a report built on it.
- Inconsistent UTM tags. Values are case sensitive, so
utm_source=googleandutm_source=Googleshow up as two sources. Use one naming convention, in lowercase. - Relying only on default events. Automatic events can’t see the actions unique to your business.
Why GA4 is a core skill for marketers
A marketer who knows GA4 can study what real people do, explain the results and show measurable gains. Businesses rely on it to make decisions, improve campaigns and see how each effort performs. If you’re hiring a marketer or an agency, ask them to walk you through your GA4 property: how they read it shows whether they decide with data or with guesses.
GA4 is also where my own reporting starts. For Glass Railing Store and RF Transparent, I join Shopify orders with Google Ads, Meta Ads and GA4 in one view, so budget decisions start from real orders. Setting this up is part of my Google Ads and Meta Ads management.
Sources
- Universal Analytics versus Google Analytics 4 dataGoogle Analytics Help, October 2026
- Get started with attributionGoogle Analytics Help, October 2026
- Reporting identityGoogle Analytics Help, October 2026
- Realtime reportGoogle Analytics Help, October 2026
- Set up Analytics for a website and/or appGoogle Analytics Help, October 2026
- Enhanced measurement eventsGoogle Analytics Help, October 2026
- Monitor events in DebugViewGoogle Analytics Help, October 2026
- Conversions vs. key events in Google AnalyticsGoogle Analytics Help, October 2026
- Mark events as key eventsGoogle Analytics Help, October 2026
- Connect Google Ads to Google AnalyticsGoogle Analytics Help, October 2026
- Engagement rate and bounce rateGoogle Analytics Help, October 2026
- Engagement overview report (average engagement time)Google Analytics Help, October 2026
- Retention overview report (new and returning users)Google Analytics Help, October 2026
- Traffic acquisition reportGoogle Analytics Help, October 2026
- Default channel group (AI Assistant channel)Google Analytics Help, October 2026
- What’s new in Google Analytics (AI Assistant channel, May 13, 2026; Dashboards, September 9, 2026)Google Analytics Help, 2026
- Funnel explorationGoogle Analytics Help, October 2026
- Get started with ExplorationsGoogle Analytics Help, October 2026
- Set up Google Analytics events in Tag ManagerTag Manager Help, October 2026
- Recommended eventsGoogle Analytics Help, October 2026
- Data Studio returns as new home for Data Cloud assetsGoogle Cloud Blog, April 10, 2026
- Data Studio release notes: Looker Studio rebranded as Data StudioGoogle Cloud, April 16, 2026
- Data Studio available connectorsGoogle Cloud, October 2026
- Schedule automatic report deliveryGoogle Cloud, October 2026
- Landing page reportGoogle Analytics Help, October 2026
- URL builders: Collect campaign data with custom URLsGoogle Analytics Help, October 2026

Bugrahan Unsal is a B2B and B2C marketing director in Toronto. He leads marketing for Glass Railing Store and RF Transparent and builds AI tools and websites. More about Bugrahan.
Follow on LinkedIn (opens in a new tab)